Why Metric Pairs Are a Game-Changer for Ecommerce Success
In the competitive world of ecommerce, understanding your data is critical to staying ahead. Focusing on individual metrics alone may result in misunderstandings and overlooked insights. Dmitry Nekrasov’s curated list of 20 paired metrics uncovers deeper patterns in business performance. These pairs help validate what your metrics truly mean, avoid false positives, and debug tricky trends faster. In this expanded blog post, we’ll explore 15 of these metric pairs, present their insights in a detailed table, propose a new pair, and provide actionable strategies to apply these insights to your ecommerce operations. Let’s dive into how metric pairs can transform your approach to data analysis.
Understanding Metric Pairs: A Deeper Look at Their Importance
Metric pairs involve analyzing two related metrics together to uncover insights that might not be apparent when looking at each metric individually. This method is particularly valuable in ecommerce, where metrics like conversion rate (CR), lifetime value (LTV), and bounce rate often interact in complex ways. For example, an increase in product views paired with a high bounce rate might indicate that your products aren’t relevant to your audience. By examining these overlaps, businesses can identify underlying issues – like poor mobile UX or checkout friction – and capitalize on strengths, such as a fast funnel. Metric pairs provide a more holistic view of performance, helping you make data-driven decisions with greater confidence.
The Metric Pairs Cheat Sheet: 15 Insights in a Comprehensive Table
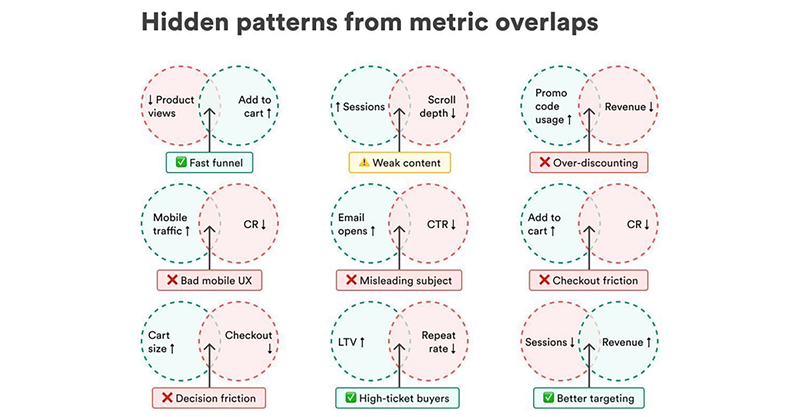
The cheat sheet visually maps out metric overlaps using Venn diagrams to highlight relationships between metrics. Below is a detailed table summarizing 15 of these pairs, including the metrics, their trends, the resulting insight, a brief explanation, and actionable steps to address the findings. Each pair is marked with a symbol (✓ for positive, ✗ for negative, ⚠️ for caution) to indicate its implication.
| Metric Pair | Trend | Insight | Explanation | Actionable Steps |
| Product Views ↓ | Add to Cart ↑ | Fast Funnel (✓) | Efficient conversion process; users quickly find and add desired products. | Scale this strength by improving search functionality or product recommendations. |
| Sessions ↑ | Scroll Depth ↓ | Weak Content (⚠️) | Users aren’t engaging deeply with content, possibly due to lack of relevance. | Enhance landing pages, product descriptions, or visuals to increase engagement. |
| Promo Usage ↑ | Revenue ↓ | Over-Discounting (✗) | Excessive discounts are eroding profit margins despite increased sales. | Reassess discount strategy; focus on sustainable promotions or loyalty rewards. |
| Mobile Traffic ↑ | CR ↓ | Bad Mobile UX (✗) | Poor mobile experience is causing users to abandon purchases. | Optimize mobile site speed, navigation, and checkout for better user experience. |
| Email Opens ↑ | CTR ↓ | Misleading Subject (✗) | Email subject lines don’t match content, leading to low click-through rates. | Test subject lines for relevance and clarity; align with email content. |
| Add to Cart ↑ | CR ↓ | Checkout Friction (✗) | Users are adding items but not completing purchases due to checkout issues. | Simplify checkout process; reduce steps, offer guest checkout, and fix errors. |
| Cart Size ↑ | Checkout ↓ | Decision Friction (✗) | Large carts lead to hesitation, possibly due to cost or unclear checkout steps. | Use cart abandonment emails, offer discounts, or clarify shipping and return policies. |
| LTV ↑ | Repeat Rate ↓ | High-Ticket Buyers (✓) | Customers make large, infrequent purchases, driving up lifetime value. | Target these buyers with loyalty programs or exclusive offers to encourage repeat purchases. |
| Sessions ↓ | Revenue ↑ | Better Targeting (✓) | Fewer but more valuable sessions indicate improved audience targeting. | Double down on high-performing marketing channels; refine audience segmentation. |
| CR ↑ | Revenue ↓ | Cheap Traffic (⚠️) | High conversions but low revenue suggest low-value customers. | Shift focus to higher-value traffic sources; adjust ad targeting for better ROI. |
| Product Views ↑ | Bounce Rate ↑ | Poor Product Relevance (✗) | Users view products but leave quickly, likely due to irrelevant offerings. | Improve product recommendations, align inventory with demand, and refine search. |
| Sessions ↑ | Bounce Rate ↑ | Misaligned Traffic (✗) | Traffic doesn’t match your target audience, leading to quick exits. | Audit marketing campaigns; refine targeting to attract the right audience. |
| Add to Cart ↑ | Checkout ↓ | Checkout Issue (✗) | Specific issues in checkout (e.g., errors, payment failures) prevent purchases. | Test checkout flow; fix technical glitches, support multiple payment options. |
| Return Rate ↑ | CSAT ↓ | Product Quality Issues (✗) | High returns and low satisfaction indicate problems with product quality. | Investigate quality, sizing, or fit issues; improve product descriptions. |
| LTV ↑ | Margin ↓ | Unprofitable Loyalty (✗) | Loyalty programs drive LTV but reduce margins, making them unsustainable. | Reassess loyalty incentives; focus on profitability with tiered rewards or upsells. |
This table serves as a quick reference for ecommerce professionals to identify patterns, understand their implications, and take corrective actions. The insights range from positive outcomes like better targeting to cautionary flags like cheap traffic, ensuring a balanced approach to optimization.
Proposing a New Metric Pair: Discount Redemption Rate ↑ | LTV ↓
To expand the cheat sheet, let’s add a new metric pair: Discount Redemption Rate ↑ | LTV ↓, which points to Attracting Price-Sensitive, Low-Loyalty Customers. When the rate of discount redemptions increases but lifetime value decreases, it suggests that your promotions are drawing deal-seekers who prioritize savings over loyalty. These customers may not return for full-price purchases, impacting long-term profitability. This pair complements existing ones like Promo Usage ↑ | Revenue ↓ (over-discounting) by focusing on the long-term effects of discounts on customer retention. To address this, consider limiting discount frequency, targeting loyalty-driven customers with personalized offers, or introducing value-added perks like free shipping to retain users without slashing prices.
Step-by-Step Guide: How to Leverage Metric Pairs for Ecommerce Growth
Using metric pairs effectively requires a structured approach. Here’s how to integrate them into your ecommerce strategy:
● Identify and Track Key Metrics: Start by monitoring metrics relevant to your goals, such as conversion rate, revenue, LTV, and bounce rate. Use analytics tools or your ecommerce platform’s built-in dashboards to collect data.
● Analyze Metric Overlaps: Look for trends in pairs over time. For example, if mobile traffic rises but conversion rate drops, you may have a mobile UX issue. Use visualization tools to spot correlations and anomalies in your data
● Interpret Insights with Context: Use the cheat sheet to understand what each pair means. For instance, Sessions ↑ | Bounce Rate ↑ indicates misaligned traffic, so you’d need to refine your marketing channels. Always consider external factors like seasonality or campaign changes when interpreting trends.
● Take Targeted Actions: Act on the insights to optimize performance. If you see Add to Cart ↑ | CR ↓ (checkout friction), streamline your checkout process by reducing steps or adding more payment options. Tailor your actions to the specific issue or opportunity identified.
● Monitor and Iterate: Continuously track these pairs to measure the impact of your changes. For example, after optimizing your mobile site, check if the Mobile Traffic ↑ | CR ↓ pair improves. Adjust strategies as needed to ensure sustained growth.
By following these steps, you can turn metric pairs into a practical framework for data-driven decision-making, ensuring you address root causes rather than surface-level symptoms.
Real-World Applications: Metric Pairs in Action with Examples
Let’s explore two hypothetical scenarios to see how metric pairs can drive actionable outcomes:
- Scenario 1: Email Open Rate ↑ | Email Unsubscribe Rate ↑
An ecommerce store notices a spike in email open rates but also a rise in unsubscribes. This pair suggests that while subject lines are compelling, the email content doesn’t meet expectations, leading to disengagement. To address this, the store could segment its email list for more targeted content, reduce email frequency, and test new content formats (e.g., product highlights or tutorials) to improve relevance and retention. Enhance your email strategy with SEO-driven traffic to attract engaged subscribers – learn how at Search Engine Optimization.
- Scenario 2: Search Volume ↑ | Search Abandonment Rate ↑
A retailer sees increased search volume on their site but a high rate of search abandonment, indicating that customers can’t find what they’re looking for. This could stem from poor search functionality or mismatched inventory. The solution might involve improving search algorithms, adding filters, and ensuring product tags align with customer search intent, ultimately reducing abandonment and boosting conversions. For broader ecommerce optimization, explore solutions at Mindbees.
These examples highlight how metric pairs can pinpoint specific issues and guide practical solutions, making them a valuable tool for ecommerce optimization.
Revolutionize Your Ecommerce Strategy with Metric Pairs
Metric pairs offer a powerful way to uncover hidden patterns in your ecommerce data, helping you validate metrics, avoid false positives, and debug trends faster. The cheatsheet by Dmitry Nekrasov provides a solid foundation with 15 actionable insights, and adding pairs like Discount Redemption Rate ↑ | LTV ↓ expands its utility by addressing new dimensions like customer loyalty and discount strategy. By integrating metric pairs into your analytics routine and complementing them with strategies like SEO from Mindbees Search Engine Optimization, you can make smarter, data-backed decisions that drive sustainable growth. Start exploring your metric pairs today with tools and insights from Mindbees to unlock the full potential of your ecommerce data.